Monitoring of Slovenian wastewaters for the SARS-CoV-2


At the National Institute of Biology, financed by the Slovenian Research Agency, we are currently performing a monitoring of Slovenian waste waters for the SARS-CoV-2 virus and mutations connected to its variants of concern. Here, we publish the results of our measurements, compare them with clinical data and provide with short interpretations.
Concentrations of SARS-CoV-2 in wastewaters
(03. 03. 2023)
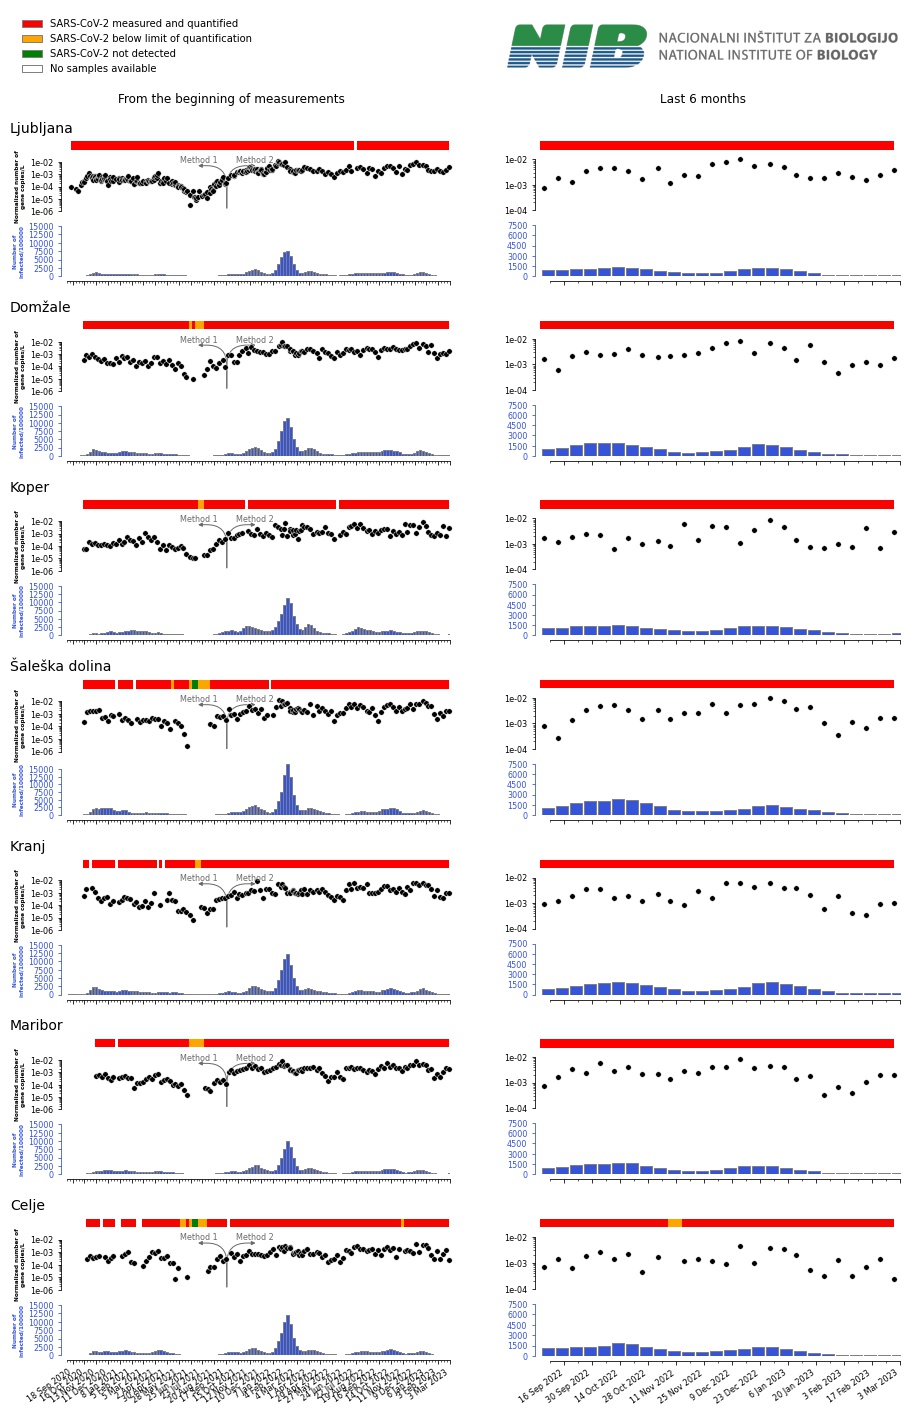
Figure explanation:
The figures show the amount of SARS-CoV-2 virus in wastewaters of individual wastewater treatment plants (WWTP) in Slovenia. The measurement of virus RNA is performed on 24h composite samples.
Traffic lights: qualitatively describe our measurements. Red means there is enough amount of virus present for quantification. Orange means that the virus was detected, but the amount of it is not enough for quantification. Green means that the virus was not detected.
Graph: black dots mark individual measurements and represent the amount of SARS-CoV-2 in the samples, normalized to the measured amount of PMMoV virus, that is used as fecal indicator (normalization allows us to minimize the influence of the environment, like heavy rain, on the measurement). The dot is only present if there is enough virus for quantification (red on the traffic light).
Bar plot: shows the number of actively infected people for municipalities that use the respective WWTP. Data taken from the COVID19 Sledilnik website (https://covid-19.sledilnik.org/sl/stats).
SARS-CoV-2 variants of concern in wastewaters
(February 2023)

Chart shows the presence of SARS-CoV-2 variants of concern (VOC) in wastewater samples of individual wastewater treatment plants. 24-hour composite wastewater samples are analysed. Each SARS-CoV-2 variant is characterized by a set of mutations. We measure the frequencies of all mutations present in a sample. Data on the chart represent the VOCs fractions estimations (based on the frequencies of detected mutations) performed by Freyja, a software tool for estimation of variant proportions from samples with mixed virus populations.
Individual bars represent the Variant Prevalence in the wastewater sample from individual wastewater treatment plant. Variants are marked with colors based on the chart legend.
We thank all partners of the monitoring:
- Ministry of Health of the Republic of Slovenia
- Ministry of Environment and spatial planningof the Republic of Slovenia
- Slovenian Research Agency,
- Central WWTP Ljubljana,
- Central WWTP Domžale-Kamnik,
- Central WWTP Maribor,
- Central WWTP Celje,
- Central WWTP Koper,
- Central WWTP Kranj,
- Central WWTP Šaleške doline,
- National Laboratory of Health, Environment and Food,
- Institute of microbiology and immunology of the Medical Faculty of University of Ljubljana,
- The Division of Paediatrics, UMCL
- COVID-19 Sledilnik