 NIB - MORSKA BIOLOŠKA POSTAJA PIRAN
Trajectory and hodograph
The web application is intended to display the trajectories of imaginary particle and hodograph on the basis of sea currents data measured at the oceanographic buoy Vida. The application was developed within the framework of NO IOC in 2016.
INSTRUCTIONS FOR USE
After starting we obtain on the screen an user interface with default values in the input fields (see figure). On the left side of the screen below the input fields we have the image of trajectory and on the right the image of hodograph. The left figure shows the trajectory of a virtual particle under the influence of sea currents measured at the buoy with a selected duration and ending at a selected date and time. The right image presents the current velocities at different heights above the seabed at a selected date and time. The descriptions of input fields are in English language, while the descriptions under figures are in Slovenian and English.
Click on the image to display the trajectory and hodograph
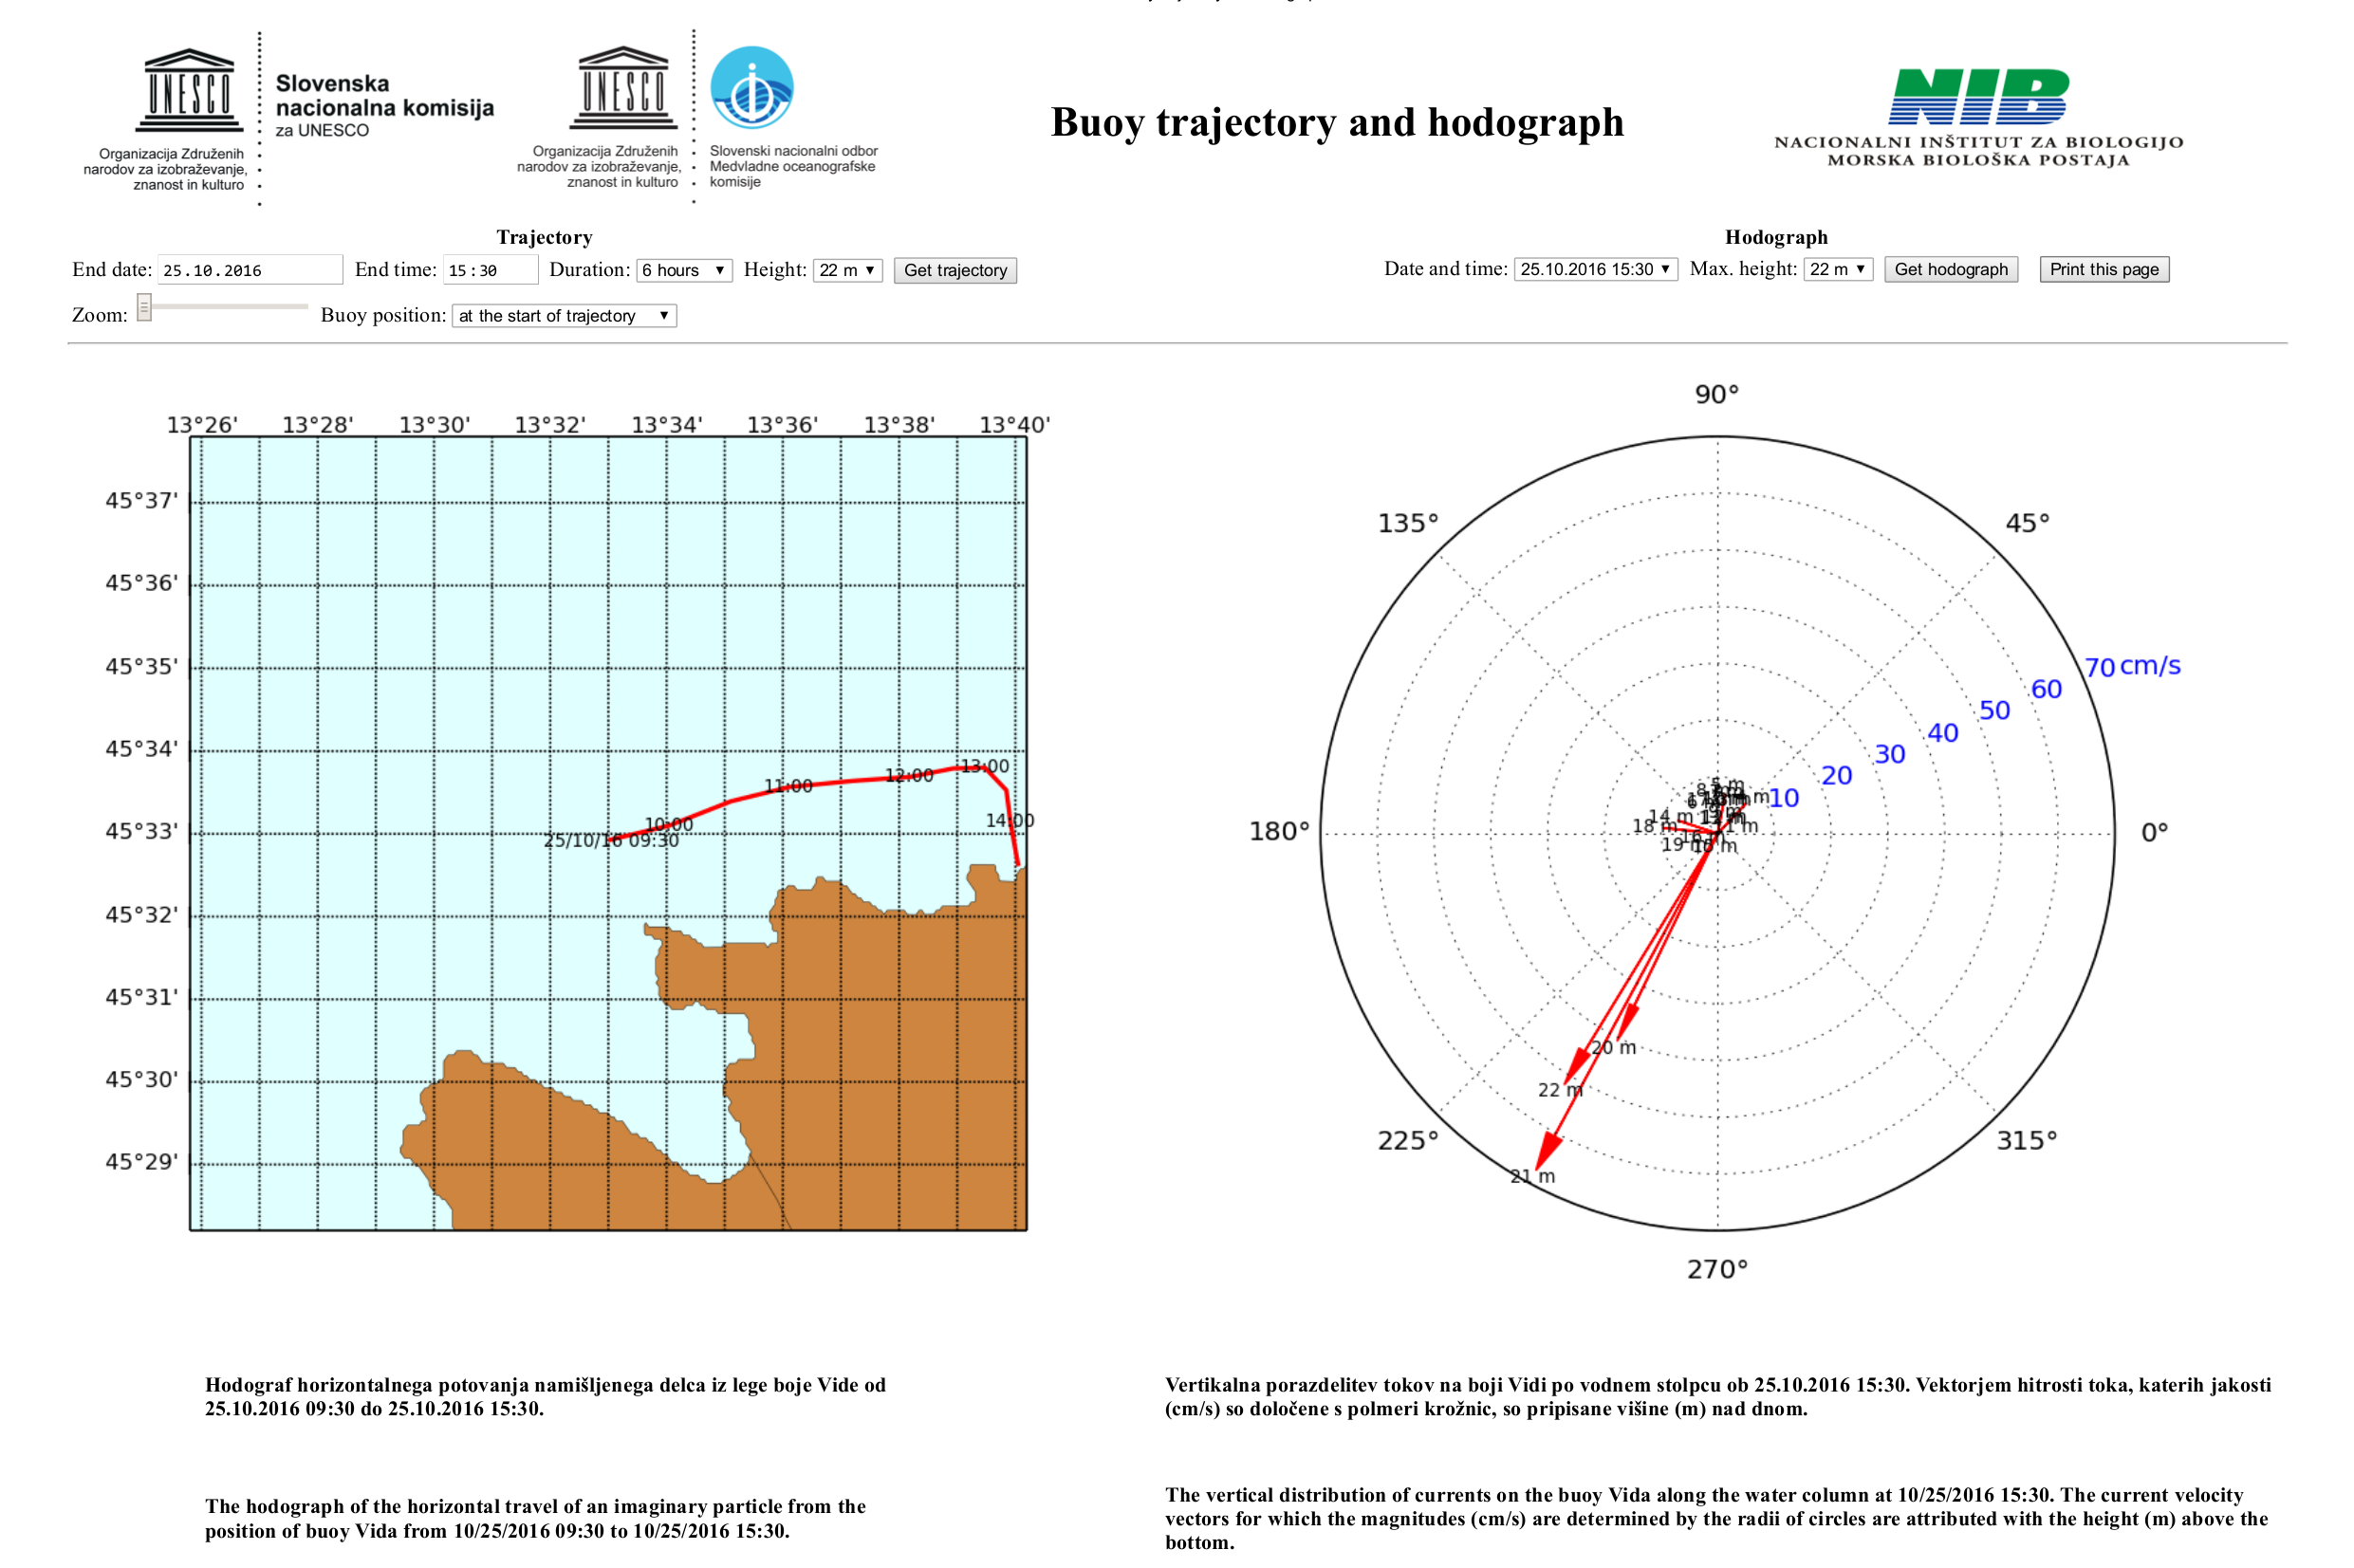
The user interface provides the following fields for entering parameters (default values are in brackets):
The left part of the screen (Trajectory):
- End date – the trajectory end date (current date).
- End time – the trajectory end time - in increments of 30 minutes (the nearest previous 30-minute interval).
- Duration – the duration (length) of the trajectory, which can be 6, 12 or 24 hours (6 hours).
- Height – the trajectory height above the seabed, which can be from 2 to 22 m in steps of 1 m. The height of 22 m is the closest to the sea surface. (22 m).
- Zoom – the slider that allows 1 - 5x magnification of the area around the oceanographic buoy Vida (1x).
- Buoy position – allows the positioning of the trajectory so that either its beginning, middle or end is at the position of the buoy (default - the beginning of the trajectory is at the buoy position).
If we alter at least one of the basic parameters of the trajectory (end date, time, duration or height of the trajectory), we have to click button »Get trajectory« to generate a new trajectory. After changing the slider "Zoom" or the selection of "Buoy Position" the application runs itself immediately, so in this case there is no need to click the button "Get trajectory".
The right part of the screen (Hodograph):
- Date and time – a combo box with a list of dates and times available to display a hodograph (the last date and time that belong to the trajectory on the left part of the screen).
- Max. height – the selection of maximum height to display hodograph – this enables the differentiation of currents velocities in the lower layers under oceanographic buoy where the velocities closer to the surface significantly exceed those in the lower layers (22 m).
If we change at least one of the above two parameters, we have to generate a new hodograph by clicking the button»Get hodograph«.
Na zgornjem desnem delu ekrana se nahaja gumb »Print this page«, s pomočjo katerega lahko spletno stran natisnemo ali pa shranimo v pdf datoteko.
On the upper right part of the screen is a button "Print this page", through which the website can be printed or saved as a pdf file.
Using different web browsers
The web application has been tested on web browsers Google Chrome, Microsoft Internet Explorer 11 and Mozilla Firefox. In doing so, Google Chrome provides the best user experience like the use of calendar to enter the date and time of the trajectory end (in other browsers, they need to be entered manually) and user-friendly printing with an easy way to configure the print parameters (format, margins, etc.).
Application developed by B. Petelin, installed by D. Deželjin